Business Intelligence & Reporting
Dashboards Your Board Actually Trusts
Most Australian businesses have dashboards. Most of them show different numbers to different people, take 20 minutes to load, and require a spreadsheet alongside them to be useful. FI Digital builds BI and reporting systems on top of governed data platforms — Databricks, Snowflake, Microsoft Fabric — that your CFO, board, and operations team agree on and rely on daily.
Trusted by Australian enterprise clients.
Why BI Fails — And How We Fix It
Business intelligence failures are almost never a reporting tool problem. They are a data foundation problem. We fix the foundation before we build a single dashboard.
Before we build a single dashboard, we ensure your data platform has a well-designed presentation layer with governed metric definitions, pre-aggregated datasets, semantic models in business language, and row-level security showing each user exactly the data they are authorised to see.
What We Build
Five BI capability areas — from board-level KPIs through FP&A, each production-delivered for Australian clients.

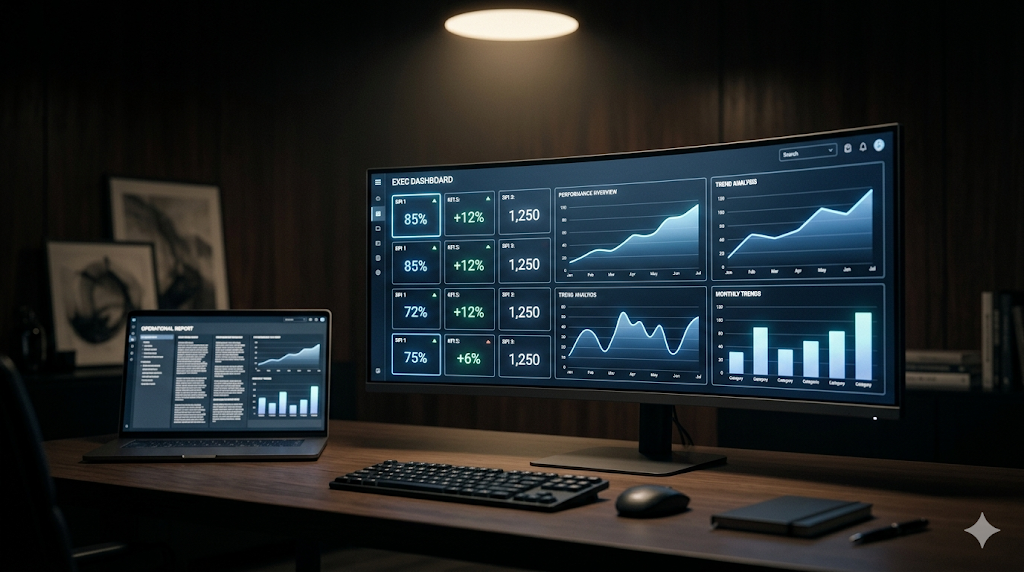
Executive and Board Dashboards
High-level KPI views for leadership and board. Revenue, margin, performance, and risk. One-click drill-down. Built for non-technical audiences.

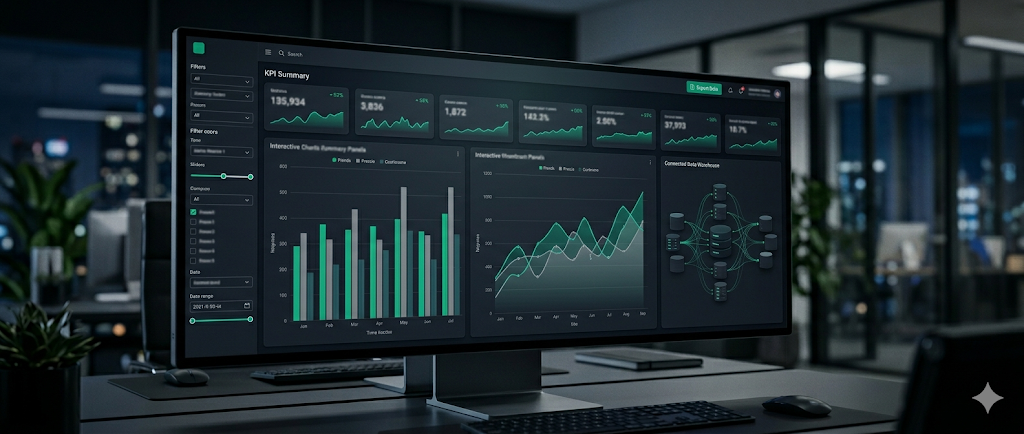
Operational & Mobile Reporting
The dashboards your operations team lives in. Job management, SLA performance, exception flagging. Under 3 seconds on large datasets.

Self-Service & MVP Analytics
A governed semantic layer your analysts query with natural language or drag-and-drop. Guardrails that prevent access to ungoverned or sensitive data.
Compliance and Regulatory Reporting
Automated compliance reports for APRA, ASIC, ACSC. Full data lineage from every figure in every regulatory submission back to its source.
Financial Planning and Analysis (FP&A)
Integrated P&L, balance sheet, and cash flow reporting. Budget vs actuals with driver analysis. Monthly close cycle from 10 days to 2 days.
Our BI Technology Approach
The right tool for your stack. No religious attachment to a single vendor. We recommend during Discovery based on your environment.
Our primary BI platform for Microsoft-stack clients. We design semantic models, implement row-level security, build DAX measures, and deploy via Premium Per User or Fabric capacity. Integration with Databricks, Snowflake, and Microsoft Fabric is native.
For clients with existing Tableau investments — we consolidate your data sources into a governed extract layer, optimise performance, and implement governance via Tableau Server or Tableau Cloud. We migrate fragmented Tableau workbooks into organised, governed projects.
For technically capable analytics teams that want version-controlled, testable metric definitions. LookML provides a code-first approach to metric governance — every metric is defined once, in version control, with automated testing. Integrated with dbt for end-to-end lineage.
All FI Digital BI implementations include a dbt layer for version-controlled SQL transformations, automated data quality testing, documentation generation, and lineage visualisation. dbt is the connective tissue between your data platform and your reporting layer — ensuring transformation logic is maintained, tested, and auditable.


Frequently Asked Questions
Stop building reports nobody trusts.
Start with a BI Assessment. We review your current reporting landscape, data foundations, and tool stack — then design a governed BI architecture that gives your organisation one version of the truth.